
I got tired of guessing how U.S. retail is really doing, so I built a dataset
For the last week I’ve been pulling comparable sales and digital growth for every U.S. public retailer, straight from their own press releases, 10-Qs and 10-Ks. No aggregators, no estimates, no “industry sources.” 52 companies, about 3,300 data points, every one traced back to the filing it came from.
It now lives on a page that updates as companies report: retailgeek.com/comps
1. Retail is growing at two speeds again.
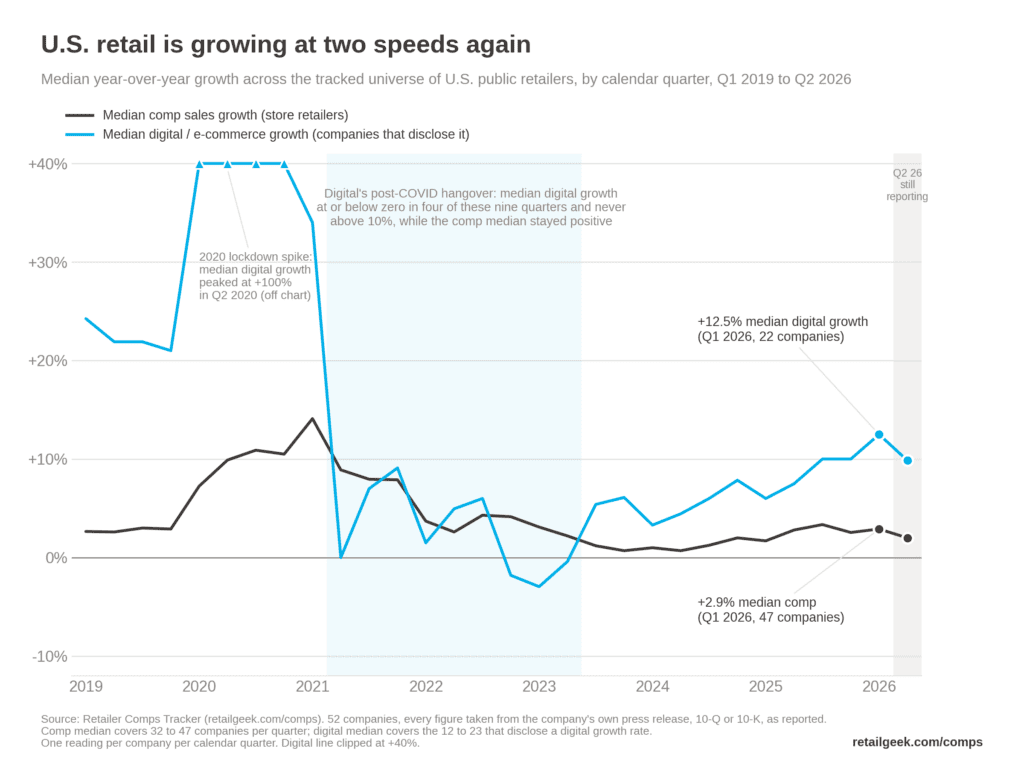
Across the 47 store retailers that reported a calendar Q1 2026 comp, the median was +2.9%. Across the 22 companies that disclose a digital growth rate, the median was +12.5%. That gap is the widest it has been since early 2021.
Digital had a real hangover after COVID. From mid-2021 through mid-2023 the median digital growth rate sat at or below zero in four of nine quarters and never topped 10%, while store comps stayed positive throughout. Digital only pulled away again in late 2024, and the median has climbed from about 6% then to 12.5% now.
2. Growth is broad again, at least through Q1.
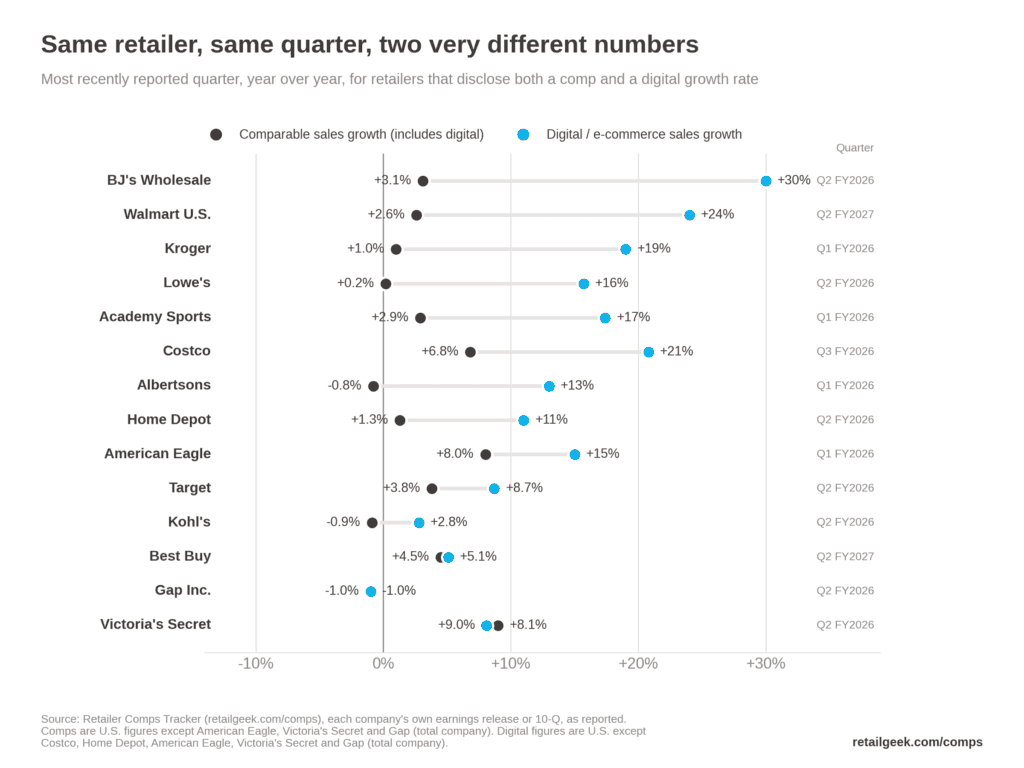
In early 2024, barely more than half of tracked retailers were posting a positive comp (27 of 46 in Q1 2024). In Q1 2026 it was 40 of 47, or 85%, the broadest quarter since 2021. The Q2 read is still filling in (41 companies so far) and looks a notch softer: median +2.0%, with 27 of 41 growing. I’ll update the page as the September reporters land.
3. For a lot of retailers, digital is all of the growth.
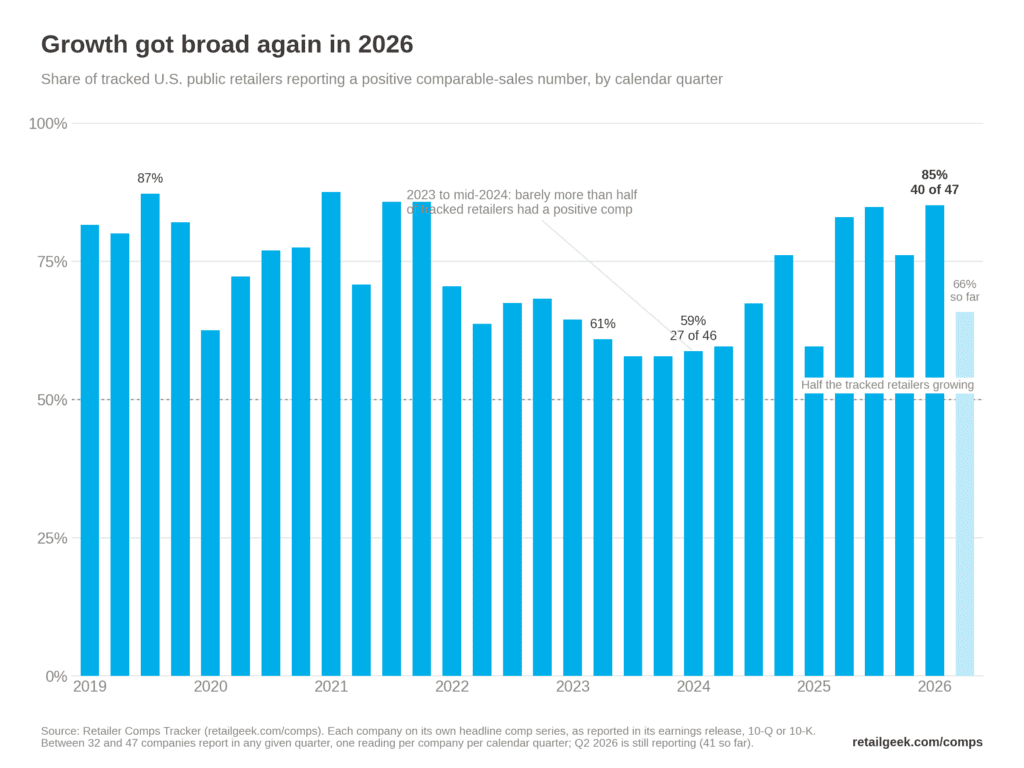
Comps include digital. So a +1% comp next to +19% digital growth means the physical store business shrank. That is the pattern right now, and it is not just a couple of names:
• Walmart U.S.: comp +2.6%, e-commerce +24% • Kroger: identical sales +1.0%, digital +19% • Lowe’s: comp +0.2%, online +16% • Albertsons: identical sales -0.8%, digital +13% • BJ’s: comp +3.1%, digital +30% • Home Depot: U.S. comp +1.3%, online +11%
All most recent reported quarter, as reported by each company. Best Buy is the counterexample worth noticing: comp +4.5%, online +5.1%.
A word of caution before anyone puts these in a deck: every digital number is on the company’s own definition, and the definitions are all over the place. Walmart’s includes advertising and marketplace revenue. Some count store pickup as digital and some don’t. The page shows each company’s definition next to the number, because the definition is half the story.
Also: 14 of the 52 companies never disclose a digital growth rate at all, and a handful that used to have stopped. Digital disclosure in retail is still a courtesy, not a standard.
What to do with this Monday morning: if you benchmark your own comp against “the industry,” stop using a single average. Pick the six to eight retailers that actually compete for your customer and compare against them, on their stated definitions.
Which comp-versus-digital gap surprises you most? And who’s missing from the tracker?